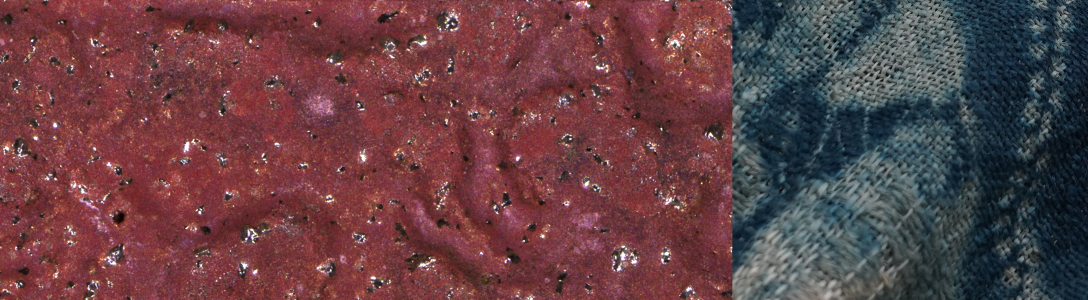

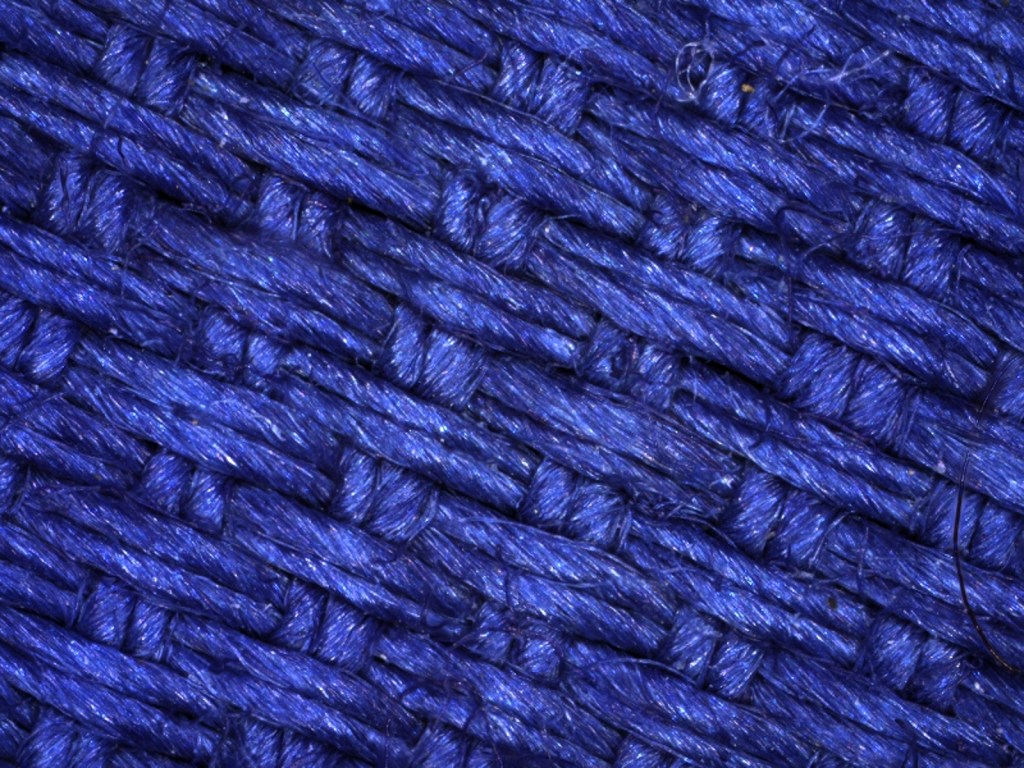
Last week I found some time to perform some preliminary studies on a sample of indigo-dyed cotton fabric. I first took some representative optical microscope images to get a sense of the distribution of dye in the cotton fibers. Below left is an image at 103x and on the right an image at 1010x.
System Administrator 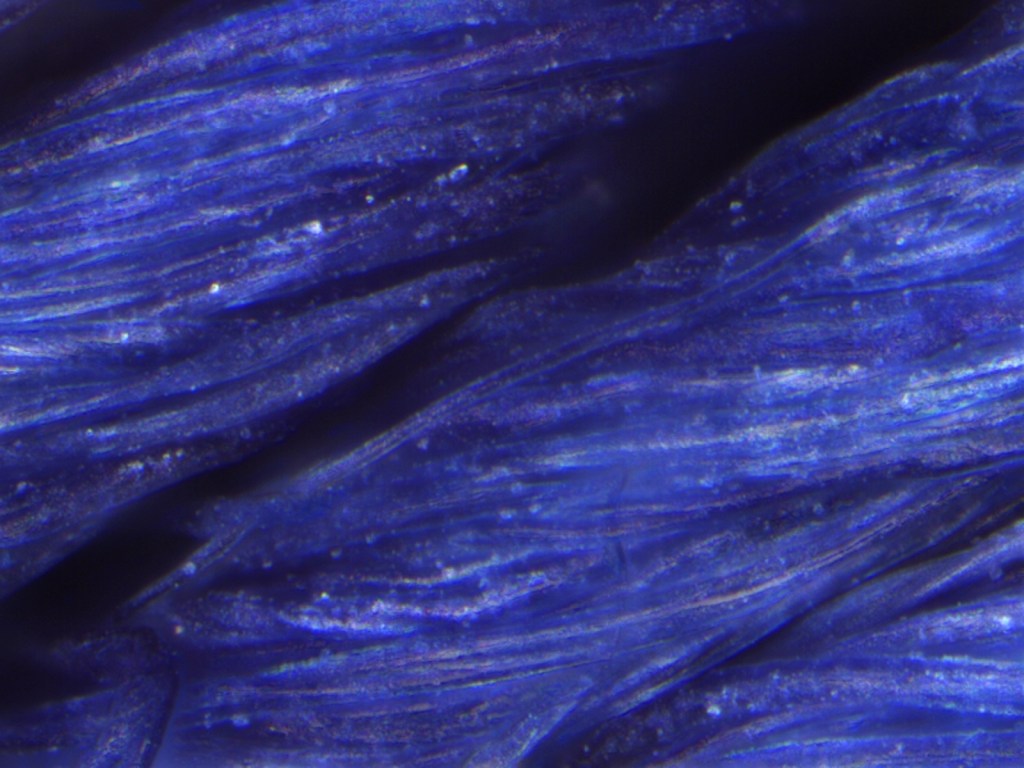
System Administrator
Even at 1000x it’s hard to see much detail of how dye “grains” or crystals might be identified in an SEM image, but at least this gives a starting point for visual inspection. The next step was to try to mount a small clipping of dyed fabric on an SEM stub. Here’s what I ended up with:

It’s not the neatest job and I should try to develop a better procedure. On this first attempt I painted some silver epoxy under the fabric, let it partially set, and then tried to press the fabric into the epoxy. I then came back and painted more silver epoxy around the edges to really secure the fabric sample to the stub (both mechanically and electrically). This epoxy needs to cure at 65C for an hour, which I did in our little vacuum oven. The friendly staff at SNSF then applied a AuPd conductive coating to get it ready for SEM imaging.
I wasn’t sure how well the cotton fibers would do in a plasma clean so I took a first series of images in the SEM without running sample cleaning. I went back at the end of my session and ran the sample cleaning procedure, and then quickly looked at the fabric again. There weren’t any clear signs of degradation so it seems like I can keep doing that as needed.
As might be expected there were some charging issues with acquiring SEM images of cotton fabric, even with the conductive coating. I was surprised to find that the charging wasn’t necessarily any different near the edges of the sample than in the center, so maybe the primary grounding path was through the underlying epoxy bed. In the end I got some acceptable images across a range (2-12kV) of accelerating voltage and 200-400V stage bias; it’s probably a good idea to study these samples in different acceleration regimes in any case. Below are some representative images, which I am not at all confident in interpreting in terms of what the “contaminants” on the fibers are. I will need to go back and do some more careful atlas imaging of the sample with the optical microscope to try to identify some apparent indigo features that could be found also in the SEM. I was having some difficulties in really tuning up the Magellan so the focus isn’t very sharp on these.
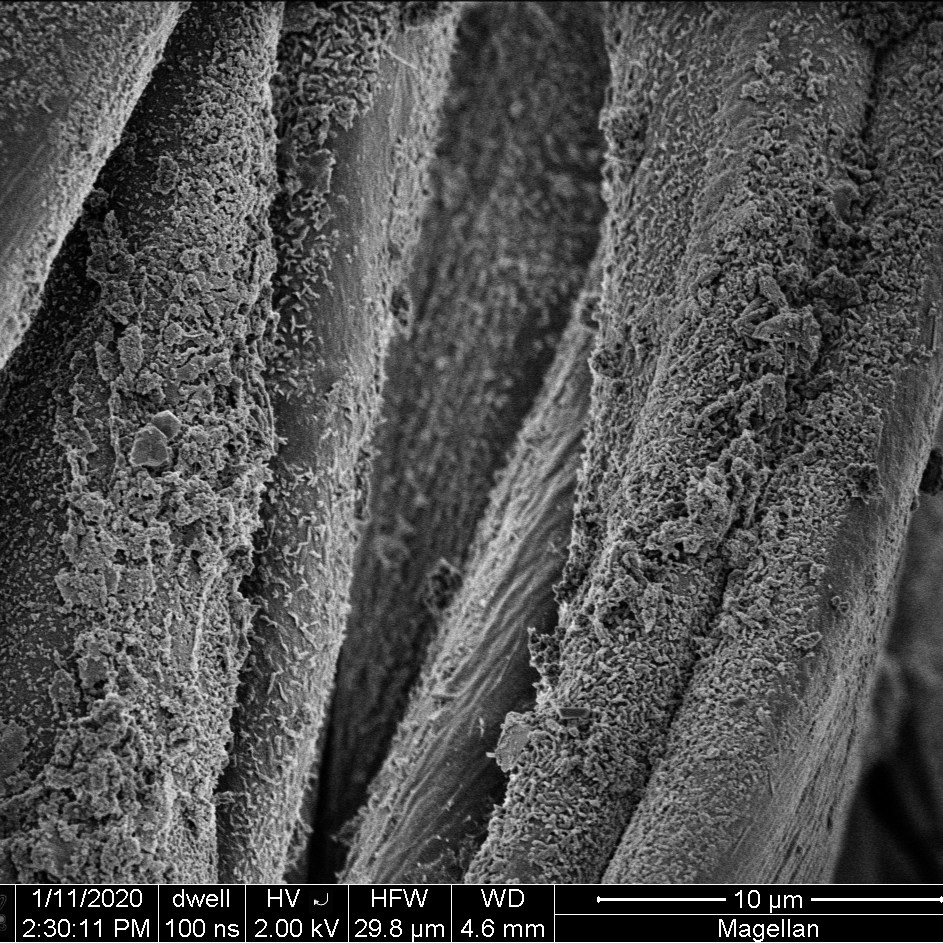


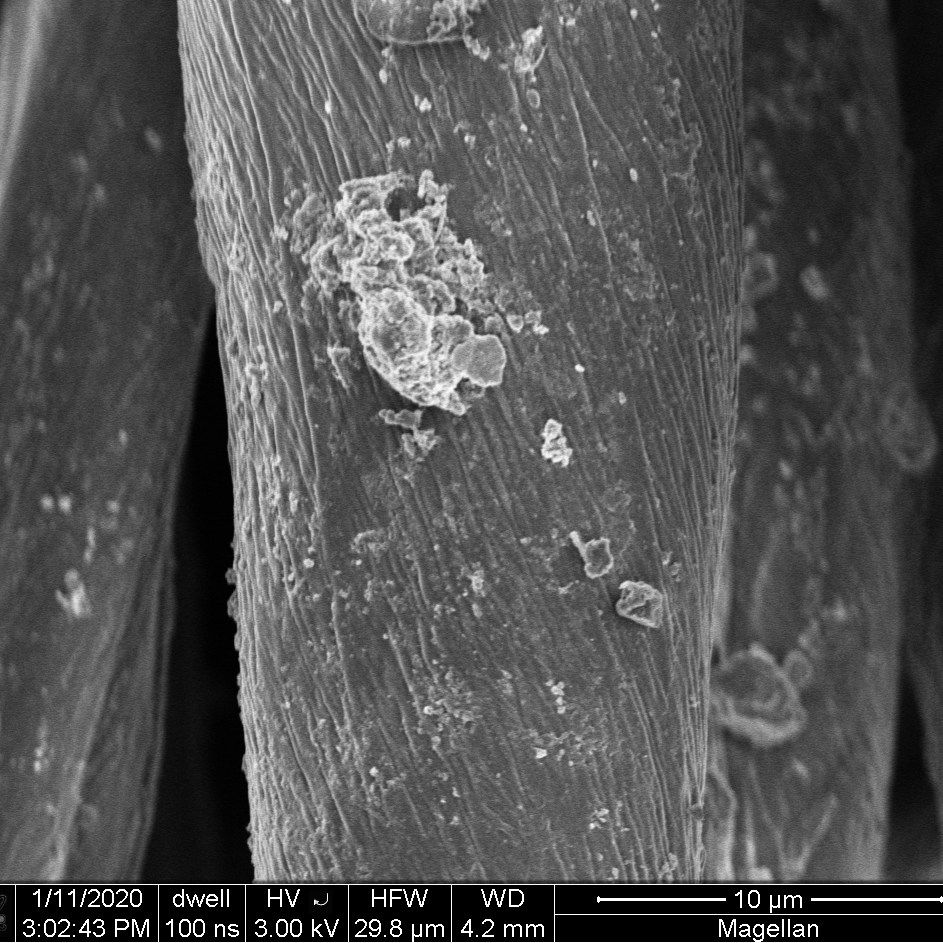
I’ve been searching online for SEM images of indigo crystals but so far no luck — I wonder if there’s a reason for that?
